
Owners and management
Business results
Targets by workspace, team and campaign, each with its pace: on track, behind or ahead.
Stop stitching reports together. See every lead, every campaign and every team in one place, and know what to do next.
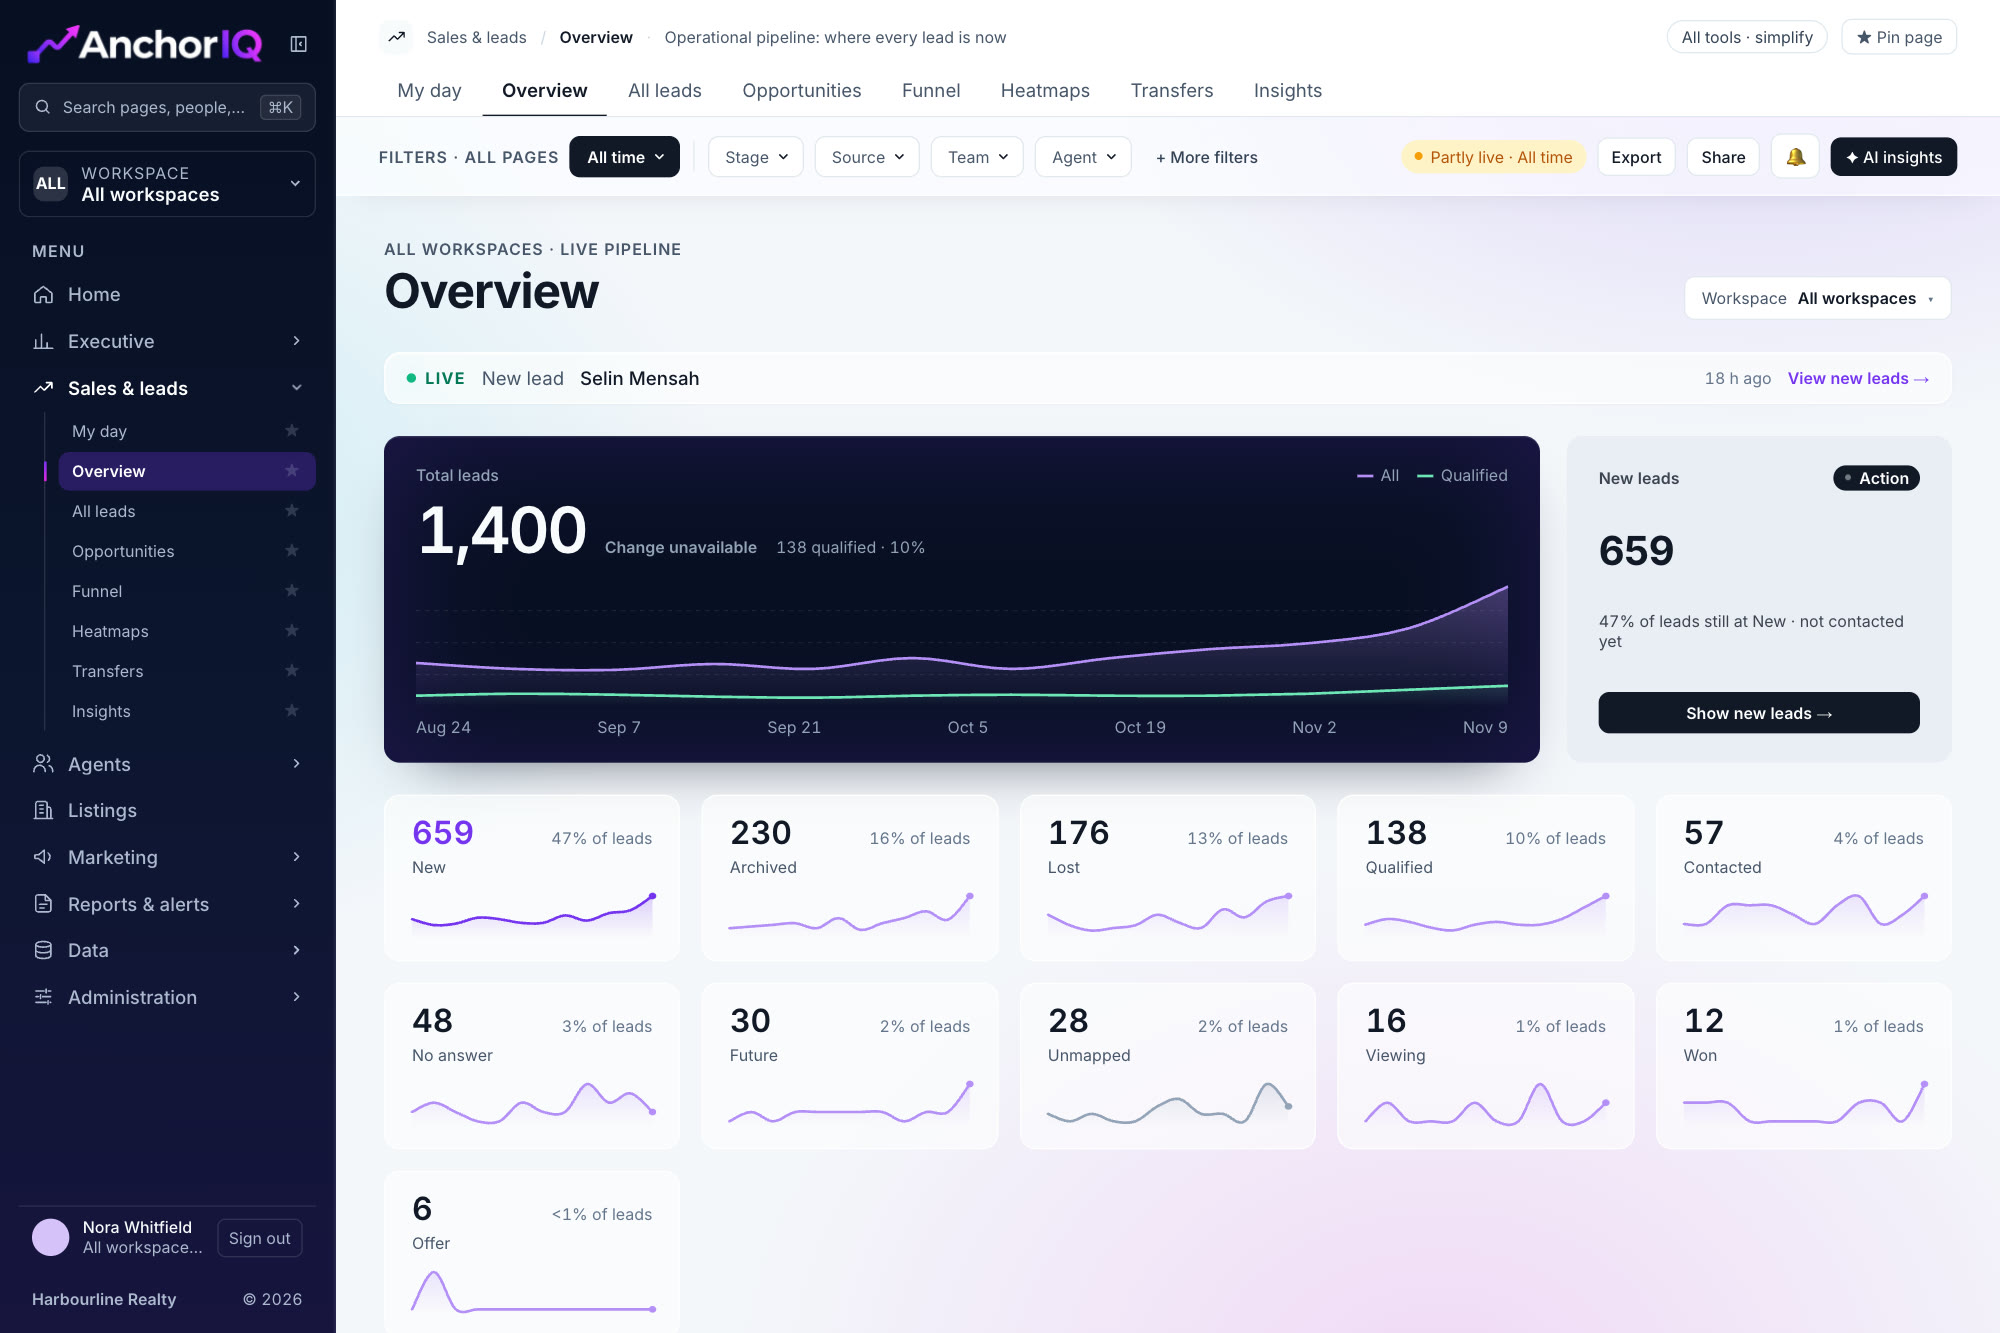
The qualification rate sits beside every lead count: {{qualText}} of {{totalLeadsText}} leads qualified in this demo view.
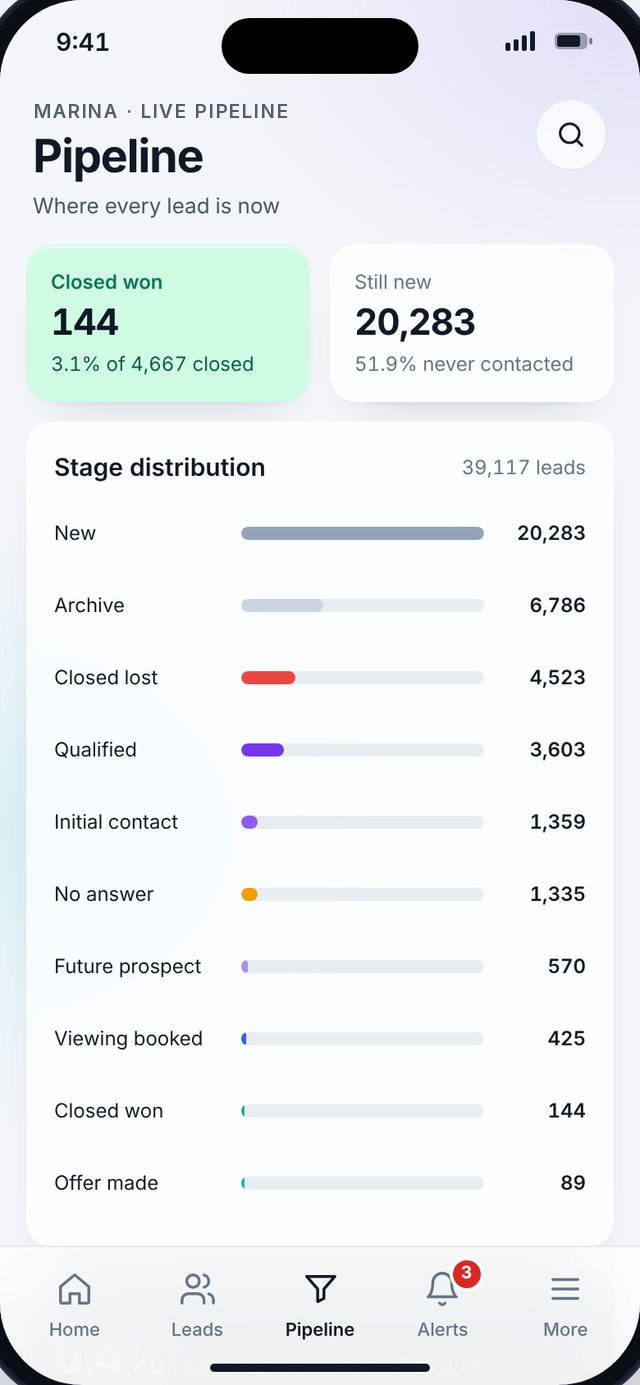
Six stages from New to Closed won. The gap between two bars is the conversation to have with the team.
Spend is matched to CRM outcomes, so each channel is judged by qualified leads, not form fills.
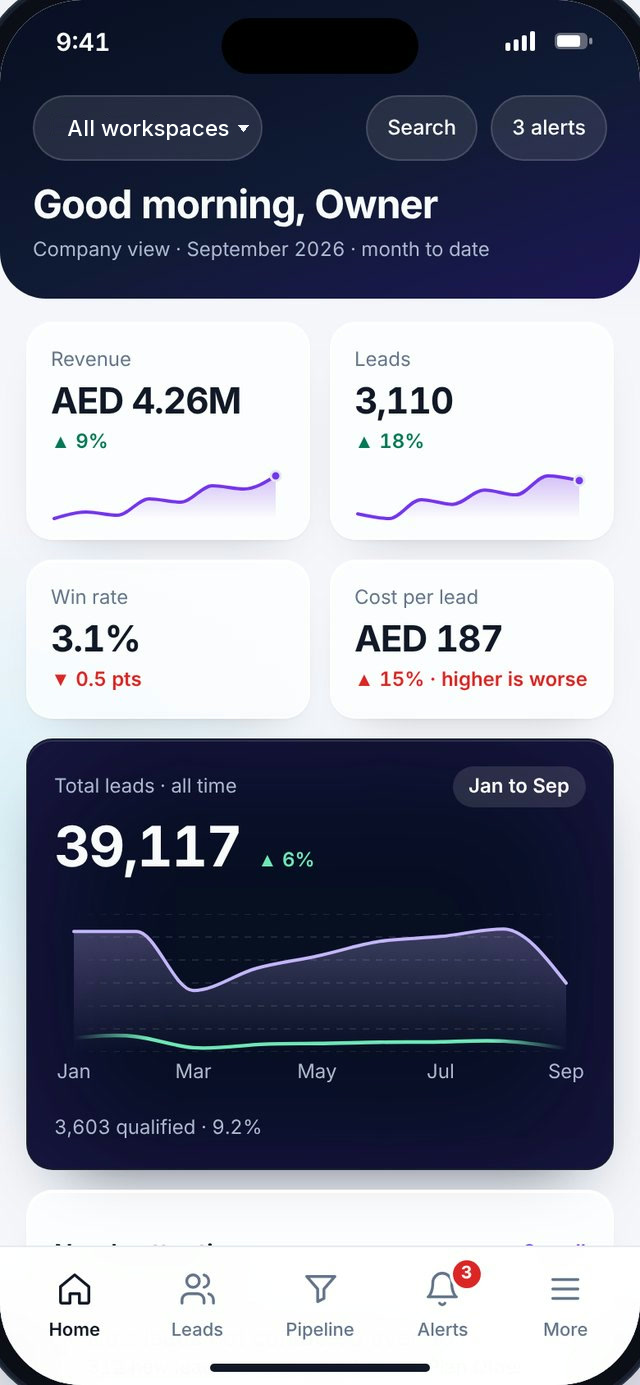
Eleven screens from the AnchorIQ dashboard, shown with sample data. Pick a tab to switch screen.
Mobile app
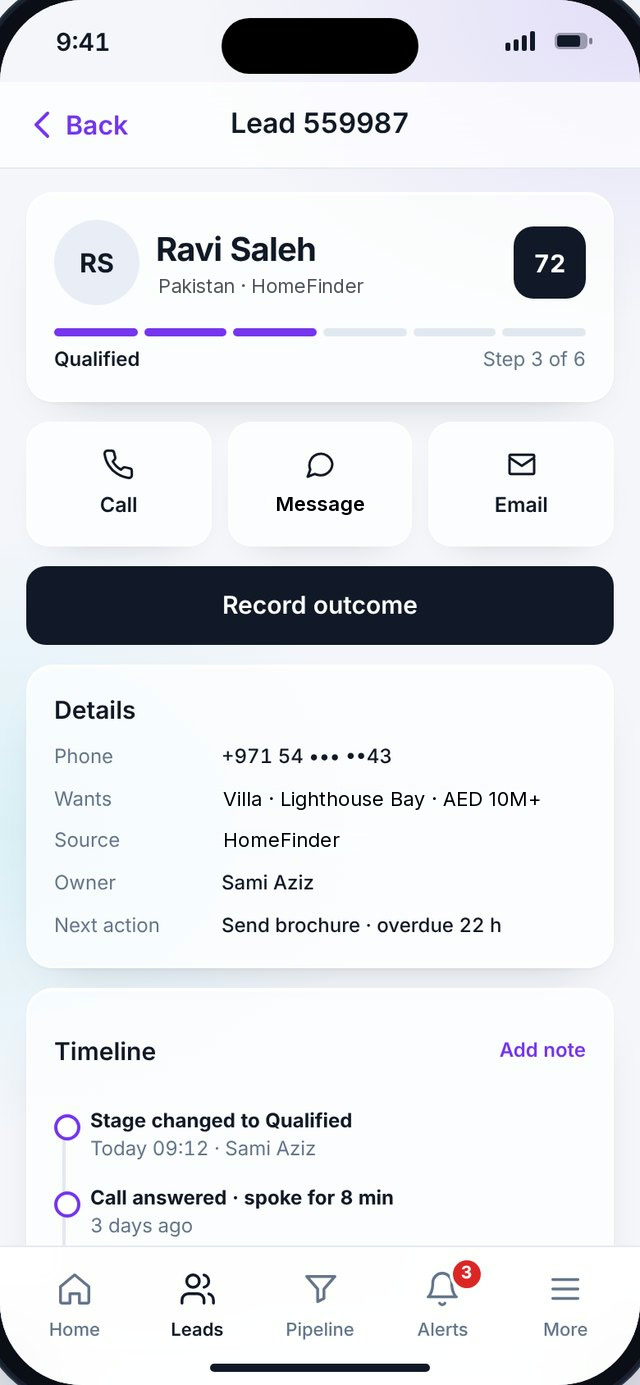
A companion app is planned. It will put leads, pipeline, alerts and goals on your phone, with a view for each role.
Management sees results, goals, forecast and AI insights
Agents get leads, tasks, viewings and a call log
Planned for iPhone and Android, installed from the website
See the mobile appDesign build. Sample data.
Connected data.
Clear intelligence.
Every source lands on the same filters, the same definitions and the same screen. The picture gets simpler as the data grows.
Six things change when marketing, sales and operations read from one view. They describe the product as designed; the roadmap below shows when each part ships.
Conversion, win rate, cost per lead and cost per qualified lead each have one written definition that sales and finance agree. Meetings stop being about whose spreadsheet is right.
Each campaign shows spend beside qualified leads, viewings and wins. Campaigns that buy enquiries but no buyers are flagged, so money moves to what converts.
Agents open a queue ordered by what is overdue. A first contact later than 30 minutes escalates to the team leader, so new enquiries are not left waiting.
The view your team works in is the report. Export it as a branded PDF or share a link, with the filters and period printed on it.
Alert rules watch response times and stage changes. Each alert opens the list of leads behind it, so the next step is one click away.
Your logo, your colours, your names for teams, roles and stages. Modules switch on per company, so nobody sees a screen they do not need.
Without one view
A separate login and export for every ad platform.
Campaigns ranked by cost per lead, because that is all the platform shows.
New enquiries wait until someone notices them.
The weekly report is rebuilt by hand in a spreadsheet.
With AnchorIQ
Every platform in one table, on one set of filters.
Campaigns ranked by cost per qualified lead and cost per win.
New enquiries land in a queue and escalate after 30 minutes.
The working view exports as the report, with filters and period on it.
Owners and management
Targets by workspace, team and campaign, each with its pace: on track, behind or ahead.
Marketing
Every platform in one table, matched to CRM stages, with cost per qualified lead beside cost per lead.
Sales managers and team leaders
Overdue leads, slow first responses and stalled stages, with lead volume shown beside every rate.
Agents
Who to call next and why, the outcome to record, and the follow-up that comes after it.
Scroll through the journey. The panel tracks how many leads reach each stage in the demo data.
Demo data: Residential sales, last 30 days.
Someone taps an ad and sends a form. AnchorIQ stores the campaign on the lead, so the spend behind it can be traced later.
The lead lands in an agent's queue. First contact is timed against a 30 minute target, and a miss escalates to the team leader.
Location, property type, budget, timeframe and purpose are confirmed. Only now does the lead count as qualified.
The viewing goes in the diary and the next follow-up is set, so the lead always has a next action.
The offer is recorded against the lead. Managers watch this stage to see the weeks ahead.
The win is credited back to the campaign that started it. That is how AnchorIQ shows what a win costs.
Sales and leads
Follow leads across ten stages, open any stage as a list, and see how each lead moved. New leads with no contact attempt are surfaced first, because they are the ones that go cold.
{{hovText}}
{{chartNote}}
Marketing
Platform reports stop at the lead form. AnchorIQ matches each platform lead to its CRM record, so a campaign is judged by what happened next. Switch the measure and watch the ranking change.
Agents and teams
Each agent works a daily queue. A first contact later than 30 minutes is escalated to the team leader, and managers compare teams on the same definitions.
{{queueNote}}
Fix today
Listings and portals, for property businessesPlanned
Property portal quality in the same view as your leads. Eight issue types flag the listings that are live but underperforming, and one click filters the directory to them.
AI Insights, arriving in the next releasePlanned
{{aiNow.q}}
{{l.text}}
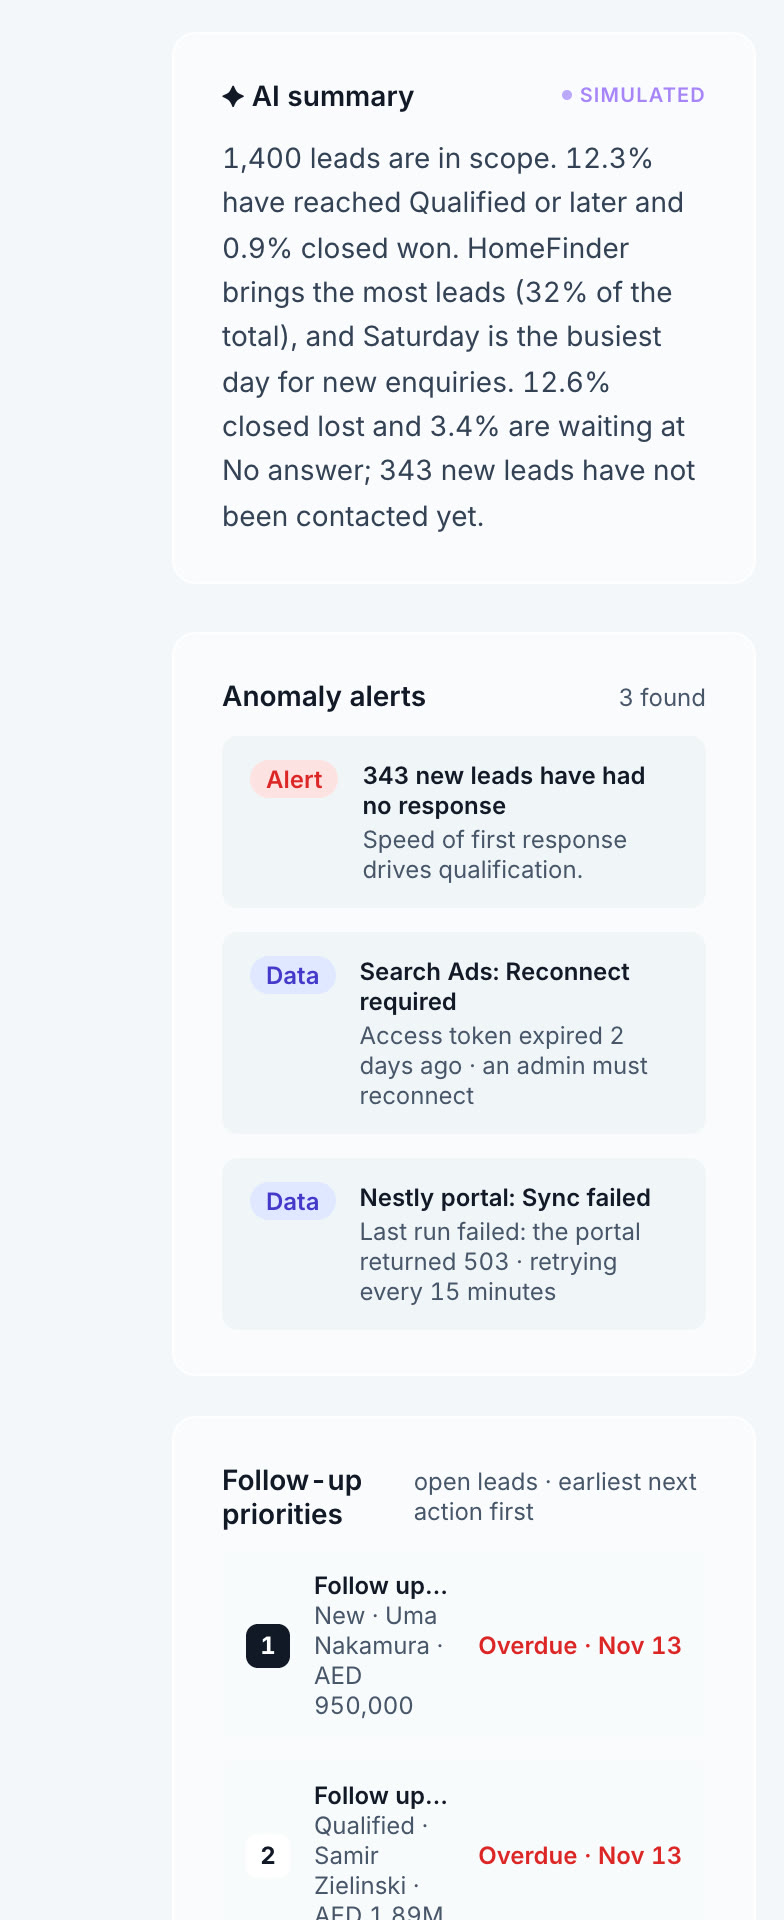
It opens beside any page and follows the filters you already have on.
Three jobs sit at the top: explain a KPI change, find neglected leads, summarise campaign quality.
Each answer shows the figures it is based on, then a button that takes you to the work.
Below it, a feed of insights, a box to ask your own question, and comments for the team.
Ask why a number moved and read the reason in plain language, instead of cross-checking three reports to find it.
It lists the leads nobody has called and the campaigns buying the wrong enquiries, so the quiet problems get seen.
Each answer carries a button that opens the queue, the campaign or the list behind it. Insight and next step arrive together.
Answers name the metrics, period and scope they used, work only from figures your role can already see, and say so when the data cannot answer. They are suggestions, not verified facts.
Advertising platforms, analytics, CRMs, property portals, files and messaging. Connections are planned by category: pick the sources your teams use and we will confirm what your rollout can include.
{{mkCount}}
Every connection listed is planned; none is live yet. Tell us what you use and we will confirm what your rollout can include.
Real estate is the most complete experience today. Outside property, AnchorIQ applies the same core platform; industry-specific workflows beyond property are not built yet.
Lead stages, agent scorecards, inventory by status, and portal quality beside your ad spend.
A workspace per client, with each client's ad accounts and access kept separate.
Pipeline, qualification and response time, without the property modules.
One workspace per branch or region, compared on the same definitions.
Targets, pace and the exceptions that need a decision this week.
First releasePlanned
Next releasePlanned
LaterPlanned
A short film of the AnchorIQ dashboard: the pipeline, the funnel, marketing, AI insights and team performance. Press play, with sound.
Once demo requests open, tell us what you need to report on. We will show you AnchorIQ on a call and send a proposal sized to your teams, workspaces and connections.
We use your details only to respond to this request.
Planned connections cover CRM systems, property portals, advertising accounts, web analytics and spreadsheet imports. None is live yet. Tell us what you use and we will confirm what your rollout can include.
It is built for brokerages first. Branding, terminology, modules and workspaces are set per company, so a sales team outside property uses the same platform with the listing modules switched off.
No. AnchorIQ is reporting only by default. Writing stages or notes back to the CRM is planned as a setting you choose to turn on.
Access follows role: agent, team leader, manager and management. Each role sees a different home screen and a different scope of leads, and you can rename the roles to match your organisation.
No. The dashboard screens and every chart on this page use sample data. Nothing here comes from a customer account.
By the size of your teams and the modules and connections you need. Once demo requests open, we will send a tailored proposal.