
headline KPIs
Revenue, opportunities, leads, conversion, spend and cost per lead.
Executive and reporting
Revenue, targets and the changes that matter, without opening five tools.
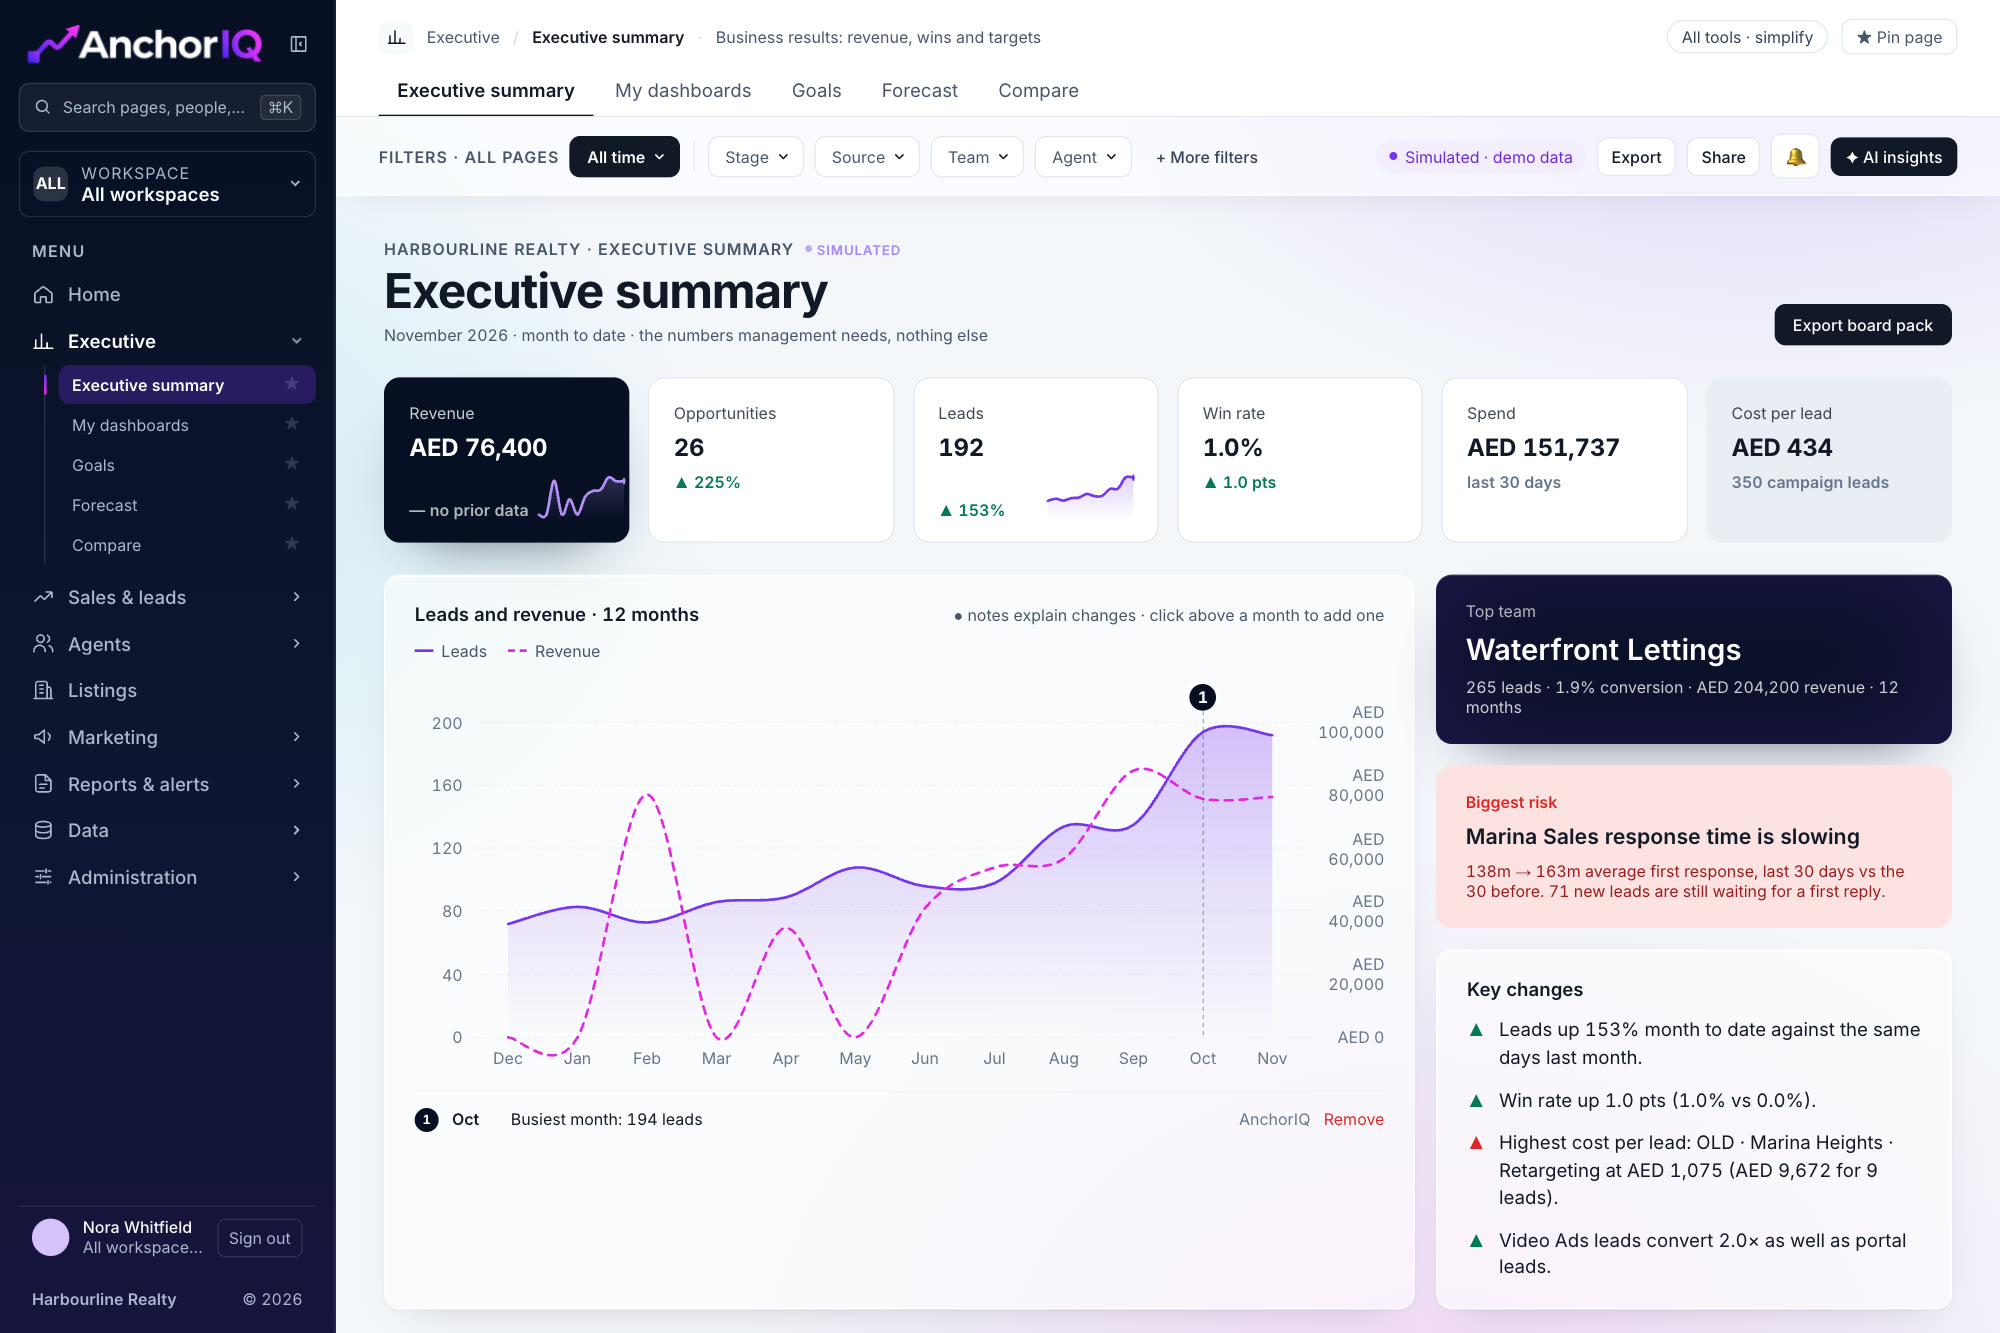
From the AnchorIQ dashboard. Sample data.
headline KPIs
Revenue, opportunities, leads, conversion, spend and cost per lead.
month trend
A chart you can annotate with dated notes.
report formats
PDF, spreadsheet or CSV.
Point at a screen to see what it shows and what is included.
{{n.p}}
{{n.cta}}Sample data
Expected leads, conversions and revenue against target, and side by side comparison of periods, workspaces, teams or sources.
Actual against projected, with a range
A summary sentence with every comparison
Build a report from the KPIs and charts you choose, as PDF, spreadsheet or CSV. Alert rules watch a metric and notify the right people.
Branded PDF export and sharing
Alert rules by metric, condition and value
Personal dashboards built from widgets
The executive summary reads its six KPIs from the same model as every other page. Point at a box to follow its path.
See the leadership view on your own targets.
Goals show pace for every target.
The summary names the biggest risk in plain words.
Key changes are listed with their figures.
Goals, alerts, PDF export and sharing are in the first release. Executive summary, forecast, compare and scheduled reports follow.
Management and managers by default. Roles and their scope are set per company.
Each metric has one written definition, and a status chip shows if a source is live, stale or unavailable.