
inventory tiles
Each one filters the directory when selected.
Listings and portals, for property businesses
Property portal quality in the same view as your leads.
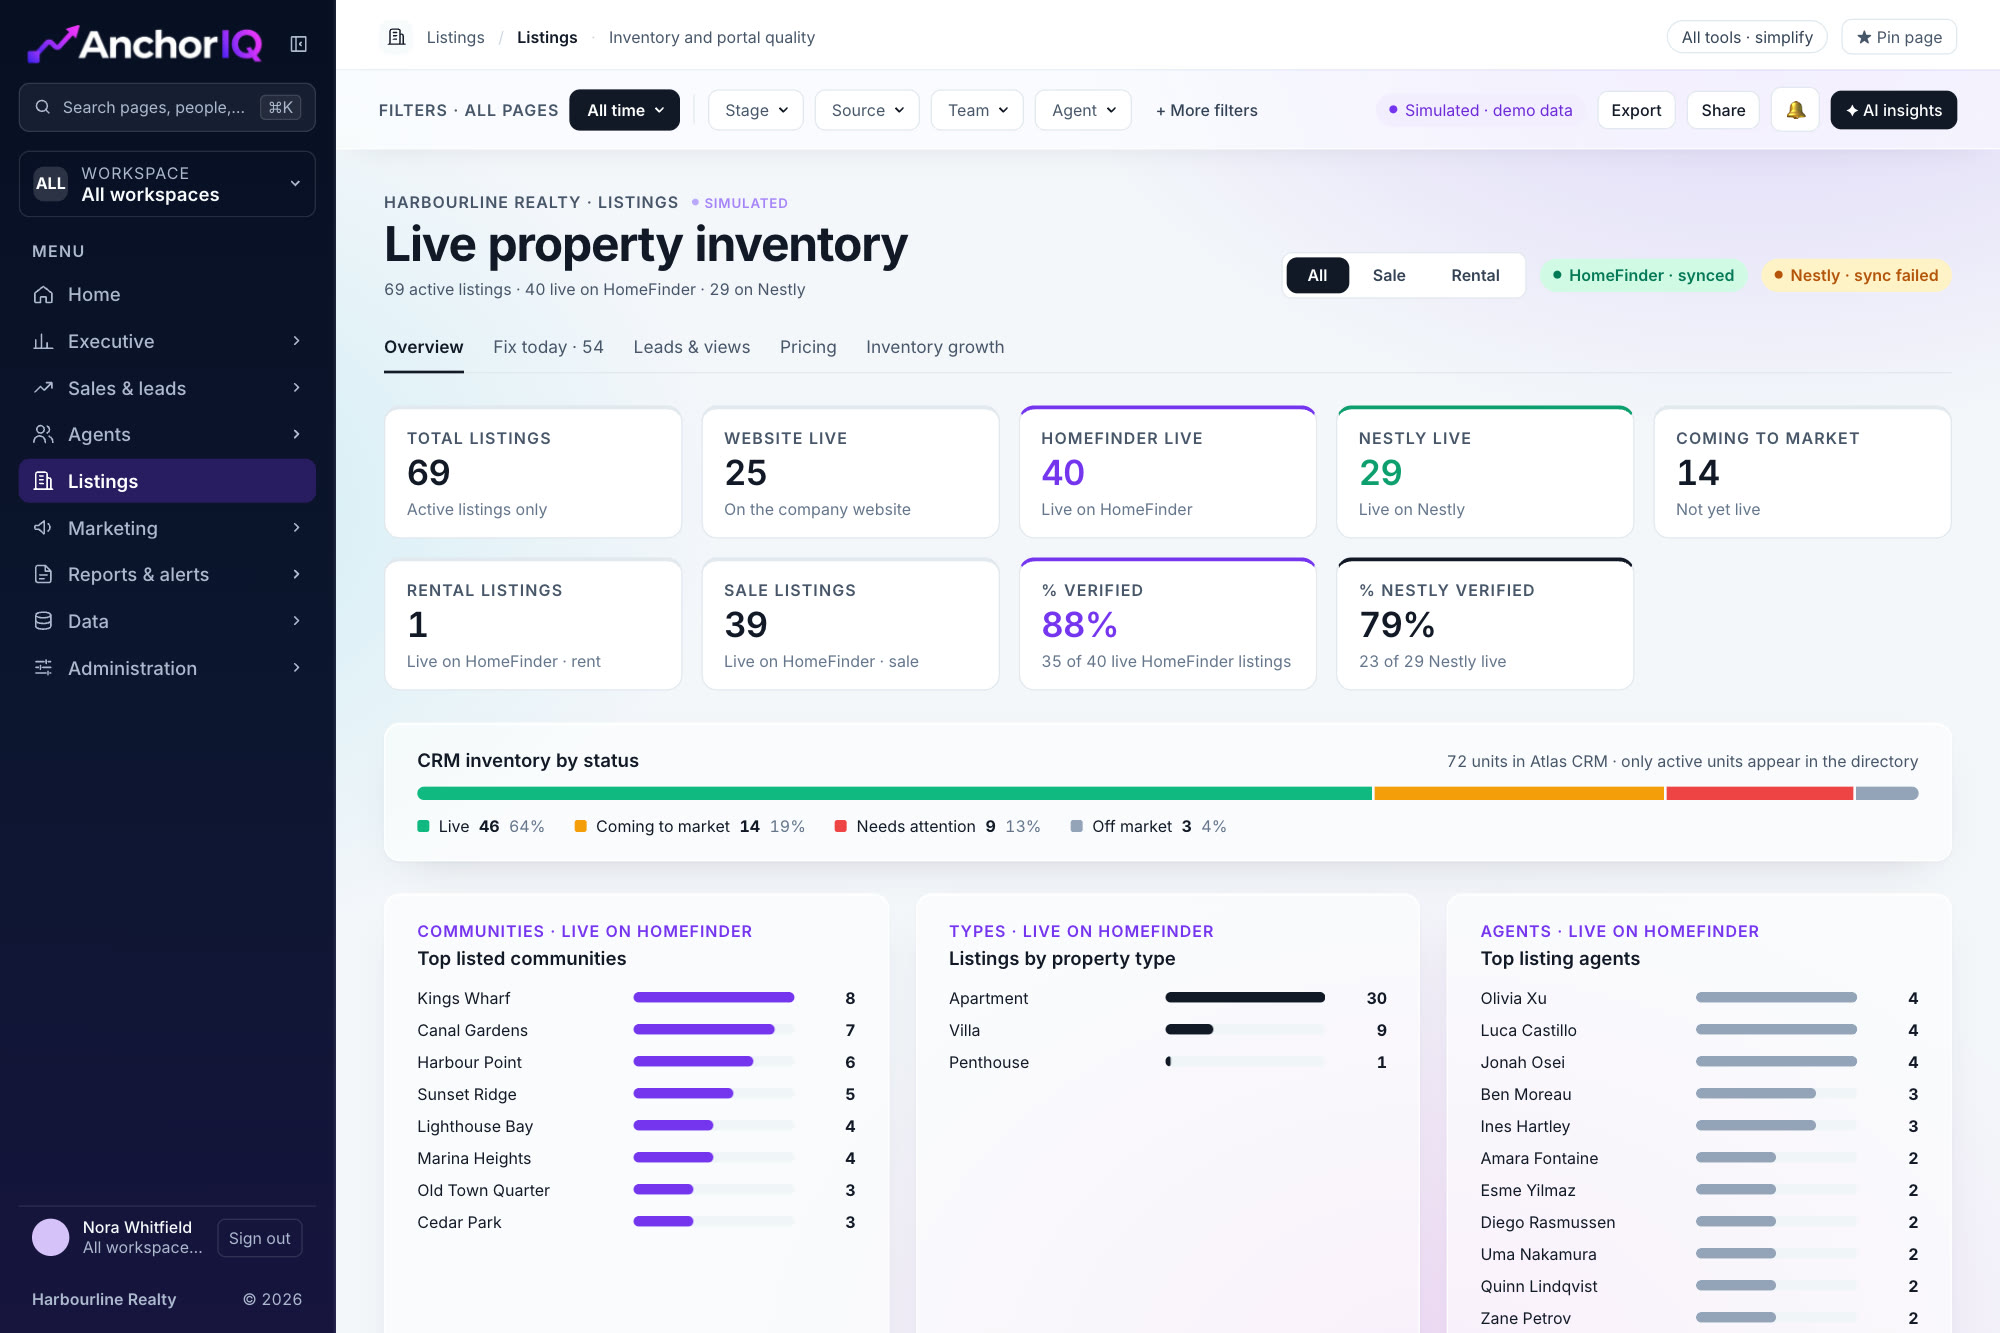
From the AnchorIQ dashboard. Sample data.
inventory tiles
Each one filters the directory when selected.
issue types
The listings to fix today, grouped by problem.
portals
Every portal, side by side.
Total listings, website live, live on each portal, coming to market, rental, sale, share verified and share TruCheck. Select a tile to filter the directory.
Sale and rental views
Inventory by CRM status
Top communities, sub communities and properties
Eight issue types point to the listings that are live but underperforming: not verified, no leads in 30 days, priced above or below market, not updated, unpublished and low click rate.
A priority table of listings with the most issues
Verification and TruCheck share for compliance
Views, clicks, click rate and leads per live listing, with the listings that draw views but no enquiries.
Top listings by leads
Leads per live listing by community
Median price per square foot by community for sale and rent, with a count of listings well above or below their community median.
Sale and rent price bands
Twelve month inventory: added against removed
What feeds the listings pages, and what they give back. Point at a box to follow its path.
See which of your listings are live but silent.
Stale and unverified listings are listed first.
Listings far from the community median are counted.
Views without leads show what is not converting.
No. Listings and portal analytics are for property businesses and switch off for others.
From the property portal connections planned for the first release.
A listing is compared with the median price for its community and purpose.